Reporting Season Wrap

Christopher Lioutas, Co-CEO & CIO

The Big Picture.
- Earnings beats and misses were at similar overall levels to February reporting season. ~30% of companies beat by 5% or more, and 22% of companies missed.
- Goldman Sachs determined that of the 20 biggest reporting season winners, not one delivered a result that led to earnings upgrades of more than 5%. This suggests that buyers were driven out of poorly performing stocks, pushing up the valuations of stocks that have delivered or avoided disappointment.
- FY26 revisions fell more than in February, most often driven by companies with large offshore operations.
- Pricing power was a key theme among the positive results, while rising competition and poor M&A outcomes were key common among weak results.
- Capital continues to be returned to shareholders with both buybacks and dividends. Buybacks increased, with $6bn of buybacks announced, while dividends were flat at $90bn. Many of the buybacks were supported by clean balance sheets.
- Consensus EPS growth for FY26 dropped through August and is now indicating ~6% EPS growth for FY26. With valuations at record highs, earnings growth will be needed to support returns over the forward period.
Sector Winners and Losers.
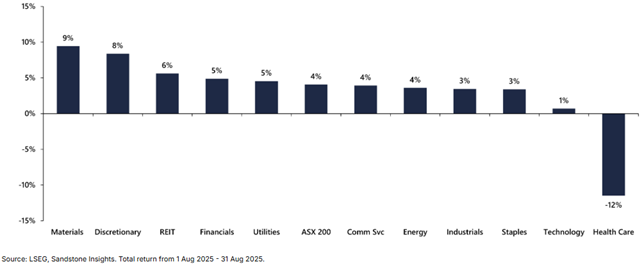
- Cyclical names and interest rate cut beneficiaries outperformed.
- Consumer discretionary showed signs of improvement. The consumer discretionary sector saw a 3.8x P/E expansion in August.
- Contractors (Ventia, Downer, Worley) posted strong performance, with improvements in industry structure providing a good backdrop for appropriate contracting and pricing.
- Firms exposed to the global residential construction sector were challenged (James Hardie, Reece, Reliance Worldwide).
- Healthcare was the only sector to see a multiple contraction (0.3x), which was further amplified by weak earnings performance.
Volatility.
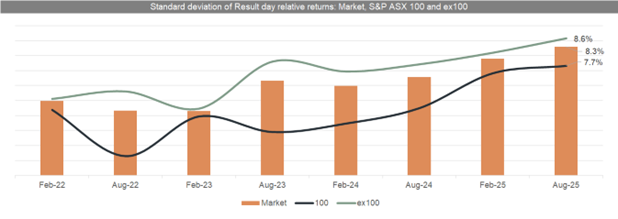
- August delivered the most volatile reporting season on record, with a standard deviation of results day relative share price returns of 8.3% (against the previous high in February 2025 of ~8% and the long-term average of 6.9%).
- 30% of companies experienced stock moves more than three standard deviations away from their average on the day of results.
- The size of the share price reactions was almost the same for beats/misses of 2.5% away from consensus expectations as it was for 5% beats/misses. This indicates that the volatility is not caused by less accurate earnings forecasts, but instead bigger and quicker changes in investor positioning in response to events.
- This all points to the increased influence on quantitative or algorithmic trading, which will process information much faster, often without accurately digesting the context or what the new information means long term. This provides opportunities for active investors, but challenges at the same time.
- These movements can be seen anecdotally too, with many stocks falling aggressively on the day of their result but recovering some (if not all) of the negative performance in the days that followed as fundamental investors digest the result and use the price falls to buy the stock.
Large vs Small Caps.
- Small caps outperformed through the period, with the ASX Small Ords index posting an 8.41% return against the ASX 200 return of 3.10%.
- Large caps saw higher volatility than small caps due to the quantitative system trading noted above, likely due to higher liquidity among large cap names.
- The average two-day relative return for industrial large caps which missed consensus EPS by more than 5% was -7.2% for the ASX 100, versus -3.8% for small caps.
- Despite the positive relative performance, small caps still trade at a meaningful discount to large caps. Historically, small caps have traded at a slight premium to large caps.
Valuations.
- Valuation changes were the most meaningful drivers of returns rather than earnings during the period.
- Big re-ratings occurred for stocks looking to stabilise after a challenging period, and for stocks increasingly proving themselves as safe havens.
- A big portion of the valuation changes were linked to sentiment, rather than earnings outlook.
Latest insights
You might also like